
Every day, thousands of traders open their phones to a simple notification:
“BUY GOLD – Entry: $2,320 | TP: $2,345 | SL: $2,308.”
But have you ever stopped to ask — how did they know?
Behind every gold signal is a complex web of analysis, data, algorithms, and human judgment. Gold signal providers don’t just guess. The best ones combine decades of market experience with cutting-edge technology to identify high-probability trade setups in the XAU/USD market.
Whether you’re a beginner trying to understand how trading signals work or an intermediate trader looking to vet your signal service, this guide breaks down the entire process from raw market data to the final buy or sell call landing in your inbox.
Let’s pull back the curtain.
What Are Gold Signal Providers?
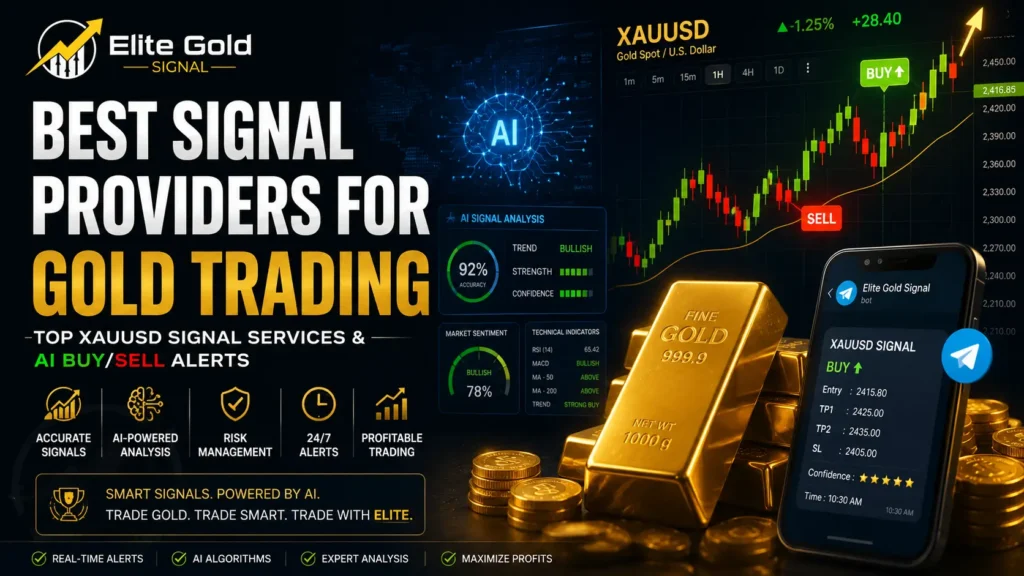
Gold signal providers are services run by individual traders, financial analysts, or automated systems that deliver trading recommendations for the XAU/USD (gold vs. US dollar) pair.
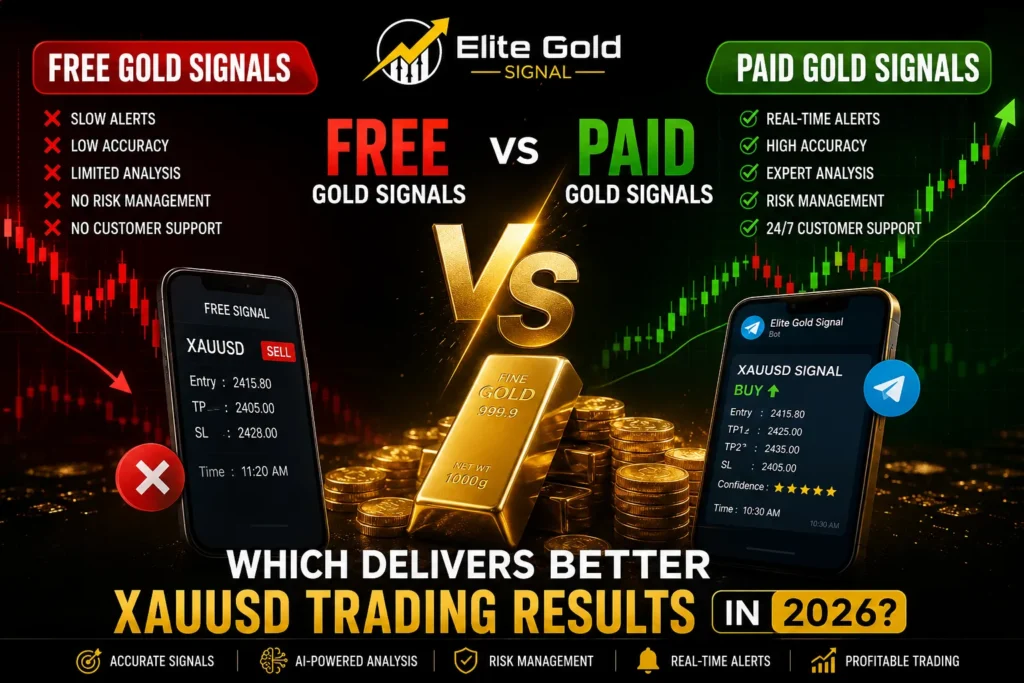
A typical gold signal includes:
- Direction: Buy (Long) or Sell (Short)
- Entry Price: The exact level to enter the trade
- Take Profit (TP): The target price for closing in profit
- Stop Loss (SL): The protective level to limit losses
- Timeframe: When the signal is valid (e.g., intraday, swing)
These signals are distributed via Telegram channels, WhatsApp groups, email newsletters, trading apps, or MT4/MT5 plugins.
The gold signals market has exploded in recent years. According to a 2023 MarketsandMarkets report, the algorithmic trading market — which includes signal generation tools — was valued at over $14.1 billion and is projected to exceed $23.7 billion by 2028.
Why Gold (XAU/USD) Requires Specialized Analysis
Gold is not just another currency pair. It’s a globally traded commodity driven by a unique blend of forces that require a specialized analytical lens.
What moves gold prices:
- US Dollar strength — Gold and the USD share an inverse relationship. When the dollar weakens, gold typically rises.
- Interest rate decisions — Federal Reserve policy directly impacts gold demand. Higher rates = stronger dollar = lower gold.
- Geopolitical risk — War, sanctions, and political instability push investors toward gold as a safe haven.
- Inflation data — CPI and PCE reports often trigger sharp gold movements.
- Central bank buying — Nations increasing gold reserves can sustain bull runs.
- COT reports — Commitment of Traders data reveals institutional positioning in gold futures.
A skilled gold signal provider understands all of these layers — not just the chart patterns.
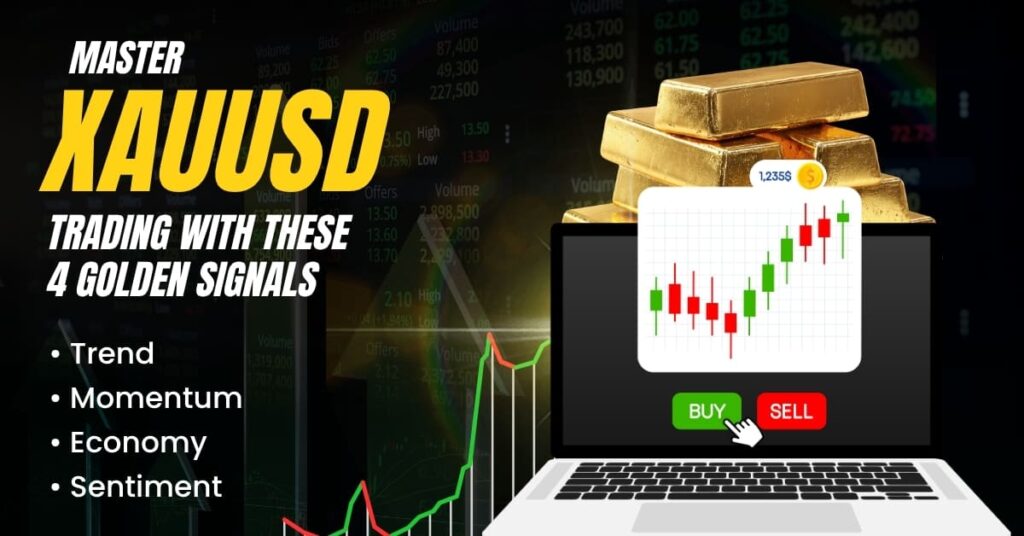
The Core Methods Gold Analysts Use to Generate Signals
Technical Analysis
This is the backbone of most signal generation. Technical analysts study price charts, patterns, and indicators to forecast future price movements based on historical behavior.
Gold’s price action follows well-documented patterns — and experienced chartists exploit this with precision.
Common technical tools used:
- Candlestick patterns: Hammer, Doji, Engulfing, Morning Star
- Chart patterns: Head & Shoulders, Double Top/Bottom, Bull/Bear Flags
- Support and Resistance levels: Key price zones where buyers or sellers historically dominate
- Fibonacci retracements: Identifying pullback entry zones (23.6%, 38.2%, 61.8%)
- Trend lines and channels: Mapping directional bias
Technical analysis is most effective when combined with other methods. Relying on it alone increases the risk of false signals.
Fundamental Analysis
Fundamentals explain why gold moves — while technicals explain when to enter.
Gold signal providers with a fundamental focus monitor:
- FOMC meetings and Fed statements: Rate hike or cut expectations shift gold dramatically.
- Non-Farm Payroll (NFP) reports: Strong jobs data typically suppresses gold; weak data lifts it.
- CPI and inflation figures: High inflation historically drives gold higher.
- US Treasury yields: Rising yields compete with gold (which pays no yield), suppressing demand.
- DXY (US Dollar Index): A real-time inverse proxy for gold direction.
- Geopolitical events: Escalating conflicts often produce rapid gold spikes.
Providers who ignore fundamentals often get blindsided by news-driven volatility. The best signals integrate both chart setups and macro context.
Sentiment Analysis
Market sentiment refers to the collective mood of traders and investors. Smart signal providers don’t just watch charts — they watch who is buying and who is selling, and how extreme the positioning has become.
Key sentiment tools:
- COT (Commitment of Traders) Report: Published weekly by the CFTC, this reveals how commercial hedgers, large speculators, and small traders are positioned in COMEX gold futures. Extreme speculative long positions often precede reversals.
- Fear & Greed Index: Risk-off sentiment increases gold demand.
- Put/Call ratios on gold ETFs (like GLD): Options market data reveals institutional hedging behavior.
- Retail sentiment data: Some brokers publish aggregate retail positioning — contrarian signals can be extracted from crowd extremes.
AI and Algorithmic Signal Generation
The newest — and fastest-growing — segment of the signal industry is AI-powered and algorithmic analysis.
These systems use:
- Machine learning models: Trained on decades of XAU/USD price data to identify repeating patterns
- Natural language processing (NLP): Scanning news headlines, central bank speeches, and economic reports for gold-relevant keywords
- Quantitative models: Rule-based systems that trigger signals when specific criteria are met (e.g., RSI crosses 30 AND price is above 200 EMA AND DXY is falling)
- Neural networks: Deep learning models that detect non-linear price relationships invisible to human analysts
AI signal systems can process thousands of data points in milliseconds — a clear advantage in fast markets. However, they lack contextual judgment and can misfire in unprecedented market conditions (like COVID-19 in 2020 or SVB collapse in 2023).
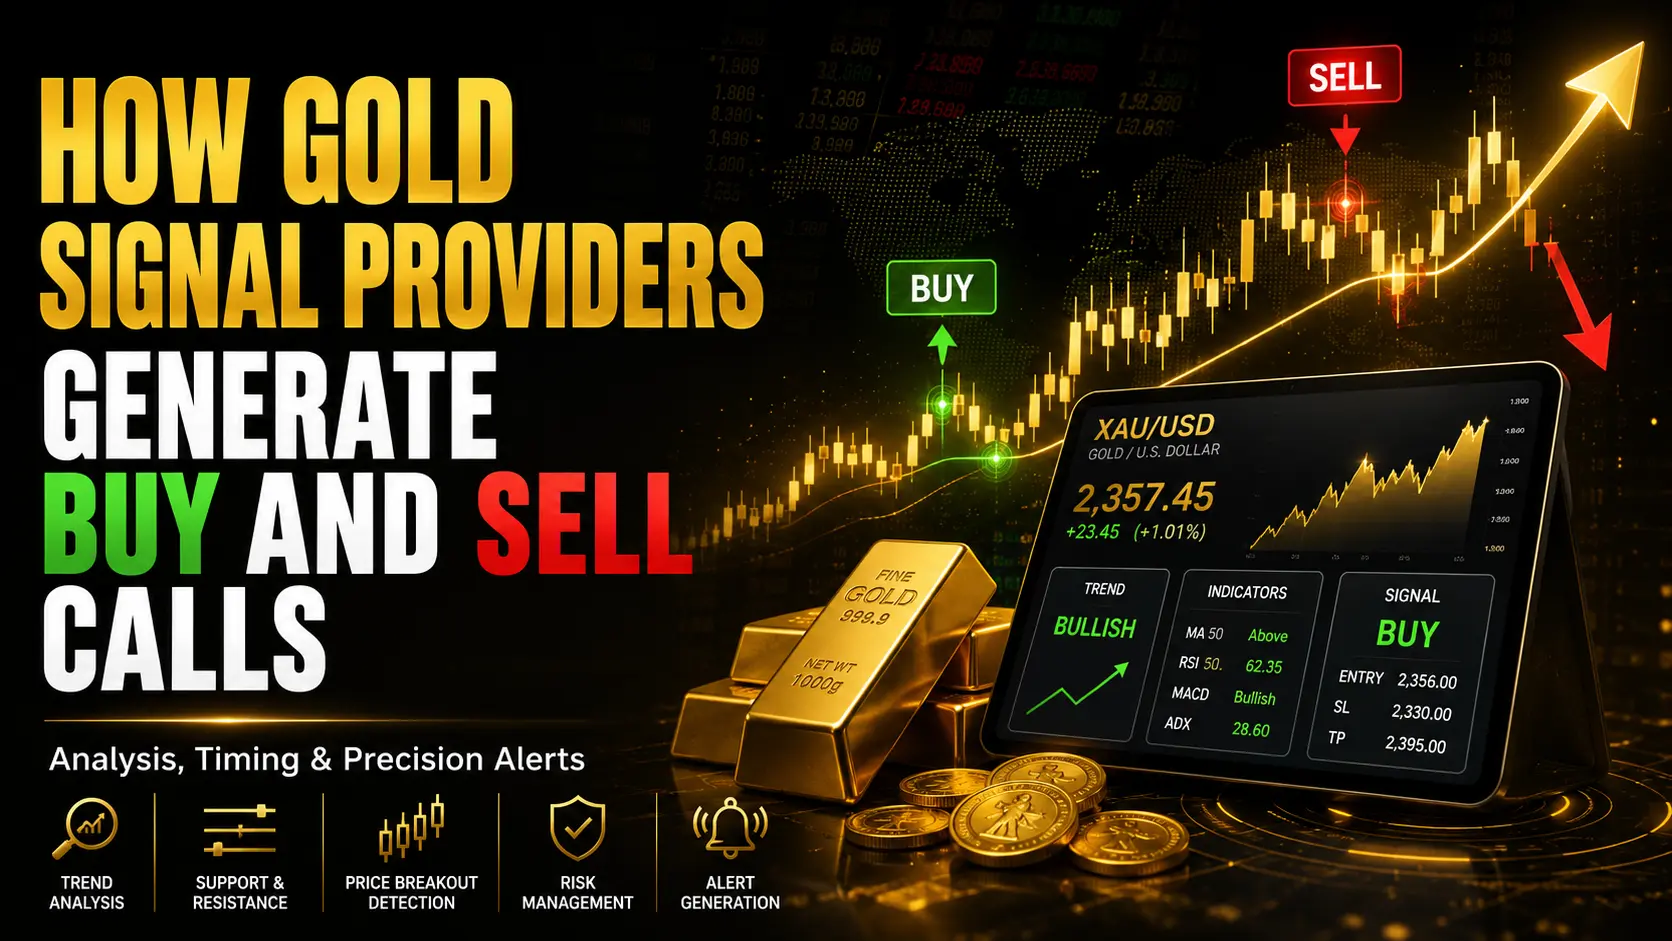
How Buy Calls Are Generated (Step-by-Step)
Let’s trace how a typical gold buy signal is born from idea to notification.
Step 1: Bias Formation The analyst establishes directional bias. Is the macro environment bullish for gold? Is DXY weakening? Are yields declining? If yes, the analyst looks for long (buy) setups.
Step 2: Identifying a Key Support Zone On the 4-hour or daily chart, the analyst marks major support — a price level where gold has previously bounced, or a significant Fibonacci retracement level (e.g., 61.8% of the last major up-move).
Step 3: Waiting for Price to Reach the Zone Patience is critical. The analyst sets alerts and waits for price to approach the identified level.
Step 4: Confirmation Triggers When price touches the zone, the analyst looks for confirmation:
- Bullish candlestick pattern (hammer, bullish engulfing)
- RSI divergence (price makes lower low, RSI makes higher low)
- MACD histogram turning positive
- Volume spike at support
Step 5: Risk Management Calculation Before sending the signal, the analyst calculates:
- Entry price (at or near support)
- Stop loss (below the support zone, typically 10–20 pips below structure)
- Take profit (next resistance level, minimum 1:2 risk-reward ratio)
Step 6: Signal Distribution The signal is sent via Telegram, email, or app push notification — sometimes with a chart screenshot for context.
How Sell Calls Are Generated (Step-by-Step)
The sell signal process mirrors the buy process but in reverse.
Step 1: Bearish Bias Check Is DXY rising? Are Treasury yields climbing? Did the Fed signal rate hikes? Are geopolitical tensions easing? If the macro picture suggests dollar strength, the analyst looks for short (sell) setups.
Step 2: Identifying Key Resistance The analyst marks major resistance zones — historic price ceilings, Fibonacci extension targets, or psychological round numbers (e.g., $2,400, $2,500).
Step 3: Bearish Confirmation at Resistance When gold reaches the resistance zone, the analyst watches for:
- Bearish candlestick patterns (shooting star, bearish engulfing, evening star)
- RSI showing overbought condition (above 70) with negative divergence
- Price rejection with long upper wicks
- Declining volume on the move to resistance
Step 4: Entry, SL, and TP Calculation
- Entry: Near resistance (often after the first bearish candle closes)
- Stop Loss: Above the resistance zone (10–15 pips above the wick high)
- Take Profit: Previous swing low or next support level
Step 5: Signal Sent The sell call goes out with all parameters clearly defined.
Key Indicators Gold Signal Providers Rely On
Here’s a quick reference table of the most commonly used indicators in gold signal generation:
| Indicator | Type | How It’s Used for Gold |
| RSI (14) | Momentum | Overbought/oversold levels; divergence signals |
| MACD | Trend + Momentum | Crossovers and histogram shifts confirm entries |
| 200 EMA | Trend | Defines long-term bull/bear trend direction |
| 50 EMA | Trend | Mid-term trend filter; dynamic support/resistance |
| Bollinger Bands | Volatility | Squeeze breakouts; extreme band touches |
| Fibonacci Retracements | Price Levels | Entry zones at 38.2%, 50%, 61.8% levels |
| Volume (OBV) | Volume | Confirms breakouts; detects distribution/accumulation |
| ATR (14) | Volatility | Calibrates stop loss distances to market volatility |
| Stochastic | Momentum | Overbought/oversold in ranging markets |
| Pivot Points | Price Levels | Daily/weekly levels for intraday signal framing |
How Signal Accuracy Is Measured
One of the biggest misconceptions in trading is that a “good” signal provider wins 90% of the time. That’s not how professional traders think.
What actually matters:
- Win Rate: Percentage of signals that hit take profit (a 55–65% win rate is considered excellent in forex/gold trading)
- Risk-Reward Ratio (RRR): A provider with a 50% win rate but 1:3 RRR is more profitable than one with 70% win rate at 1:1 RRR
- Profit Factor: Total gross profit ÷ total gross loss. A factor above 1.5 is considered good; above 2.0 is excellent
- Maximum Drawdown: The largest peak-to-trough decline in account equity. Lower is better
- Consistency: Month-over-month performance stability matters more than a few huge wins
Example: If a provider sends 100 signals with 55 wins (TP hit) and 45 losses (SL hit), but uses a 1:2 RRR — they make 55 × 2 = 110 units and lose 45 × 1 = 45 units. Net: +65 units profit.
Always ask for verified track records — not just cherry-picked screenshots.
Manual vs. Algorithmic Signal Providers: A Comparison
| Feature | Manual (Human Analyst) | Algorithmic (AI/Bot) |
| Speed | Slower (minutes to hours) | Near-instant (milliseconds) |
| Adaptability | High (reads context) | Low (struggles with novel events) |
| Emotion | Can be biased or inconsistent | Emotionless and consistent |
| Transparency | Usually explains reasoning | Often a “black box” |
| Backtesting | Limited | Extensive historical data available |
| Cost | Often subscription-based | Can range from free to expensive |
| Best for | Swing traders, news-driven moves | Scalpers, high-frequency setups |
The ideal? Many top providers use a hybrid approach — algorithms identify candidates, human analysts filter and confirm before sending.
Red Flags to Watch Out For
The signal industry is rife with fraud. Here’s how to spot a bad provider fast:
- “99% accuracy” claims — No legitimate analyst wins 99% of the time. This is a marketing lie.
- No track record or only screenshots — Screenshots can be faked. Look for third-party verified results (e.g., Myfxbook, FX Blue).
- No stop losses — Some providers send signals without SL to appear accurate. This is reckless and dangerous.
- Pressure to use their broker — Kickback arrangements can bias signal quality.
- Upfront large fees with no free trial — Legitimate providers often offer trial periods.
- Telegram channels with paid members — Fake engagement is easy to manufacture.
- Guaranteeing profits — Regulated financial advice cannot guarantee returns. Anyone who does is either lying or operating illegally.
How to Evaluate a Gold Signal Provider
Use this checklist before committing:
Track Record Verification
- Are results verified by a third-party platform (Myfxbook, FX Blue, Signal Start)?
- Does the history cover at least 6–12 months?
- Are losing trades shown (not just winners)?
Risk Management Standards
- Does every signal include a stop loss?
- What is the average risk-reward ratio?
- What is the average lot size relative to account size?
Transparency and Communication
- Do they explain the reasoning behind each signal?
- Are they active in community Q&A?
- Do they acknowledge losing streaks honestly?
Regulatory Awareness
- Do they disclaim that signals are for educational purposes, not guaranteed financial advice?
- Are they based in a regulated jurisdiction?
Community and Review
The Future of Gold Signal Generation
The gold signal industry is evolving rapidly. Here’s where it’s heading:
AI-Driven Multi-Factor Models Future signal systems will fuse sentiment data, macroeconomic indicators, on-chain data (for crypto-correlated moves), and price action into unified models that update in real-time.
Natural Language Processing for Economic Events NLP tools already parse Fed minutes and press conferences but future systems will interpret tone, nuance, and uncertainty in central bank language to anticipate gold moves before markets react.
Integration with Retail Platforms Expect tighter integration between signal providers and brokers auto-trade execution, real-time risk adjustments, and position sizing based on individual account parameters.
Regulatory Scrutiny As the industry grows, financial regulators in the EU, UK, and US are increasingly scrutinizing signal services. Providers operating without proper disclosure or licensing are at risk. This is ultimately good for traders pushing the industry toward accountability.
Personalized Signals AI will enable signal customization signals filtered by your risk tolerance, trading hours, account size, and preferred timeframes rather than one-size-fits-all notifications.
Conclusion
Gold signal providers operate at the intersection of art and science — blending technical precision with macro awareness to deliver actionable trading calls to thousands of traders worldwide.
The best providers don’t just send signals. They build a framework combining price action analysis, economic data, sentiment readings, and rigorous risk management — to identify high-probability setups in the volatile XAU/USD market.
As a trader, your job isn’t just to follow signals blindly. It’s to understand the logic behind them, verify the track record of whoever is sending them, and apply proper position sizing so that no single signal can significantly damage your account.
The gold market will always offer opportunities. The edge belongs to those who stay informed, stay disciplined, and choose their signal providers w
Call to Action (CTA)
Ready to trade smarter? Before subscribing to any gold signal service, demand verified performance data, transparent risk metrics, and a clear explanation of the methodology.
Start with Elite Gold Signals to test our signal accuracy before risking real capital.
FAQ
Accuracy varies widely. Top-tier providers achieve 55–70% win rates with good risk-reward ratios. Always verify with third-party track records rather than relying on provider claims alone.
Most charge monthly subscription fees ranging from $30 to $300+. Some earn affiliate commissions from brokers when clients sign up through referral links — which can create a conflict of interest.
Most professional signals are based on H1 (1-hour), H4 (4-hour), or Daily charts. Scalping signals (M1–M15) carry more noise and are harder to execute for retail traders.
Yes. Many providers offer Expert Advisors (EAs) or integrate with platforms like ZuluTrade, Myfxbook AutoTrade, or NAGA to automatically copy trades into your account.
Yes, following trading signals is legal. However, signal providers who present their service as financial advice without proper licensing may be operating in violation of financial regulations in some jurisdictions.
A minimum of 1:2 (risk $1 to potentially earn $2) is considered acceptable. Professional providers typically target 1:2 to 1:3.
Intraday signals typically expire within the same trading session (4–8 hours). Swing trade signals may remain valid for 1–5 days. Always check the signal’s stated validity window.
The best providers use both. Technical analysis identifies when to enter; fundamental analysis validates why the setup makes sense in the current macro environment.