


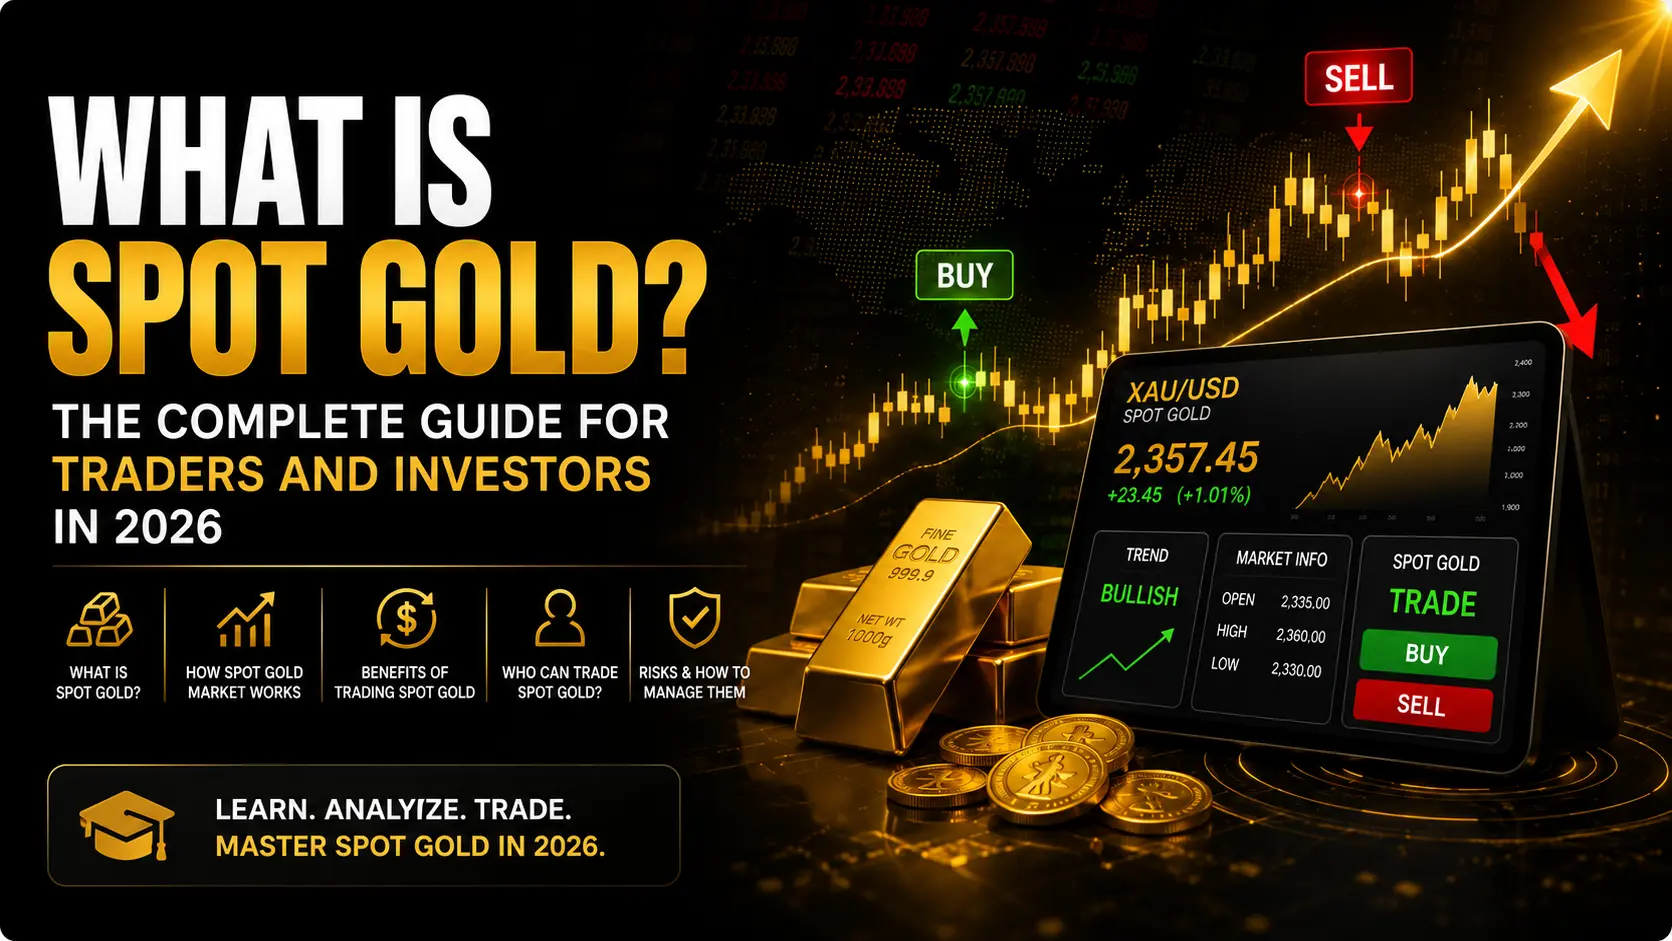
Spot gold is the current live price at which one troy ounce of pure gold can be bought or sold for immediate delivery in the global wholesale market. The word “spot” simply means right now as opposed to a price locked in today for delivery weeks or months in the future.
If you have ever searched “gold price” and seen a constantly updating number on a financial website, that is the spot gold price. It is the universal benchmark from which every other gold product physical bars, coins, ETFs, futures contracts, and even jewellery derives its value.
Understanding what spot gold is, and how it moves, is one of the most foundational pieces of knowledge any gold investor or trader can build. In 2026, with gold having hit an all-time high above $5,500 per ounce in January and now trading around the $4,078–$4,224 range, reading the spot price correctly has never been more important.
Let’s break it down from the ground up.
How Is the Spot Gold Price Set?
This is where most beginners and even some intermediate investors get confused. The spot gold price is not set by a single exchange or regulator. It emerges from a distributed global network of institutional buyers and sellers transacting continuously across multiple markets.
The London OTC Market
The dominant centre for global gold pricing is the London over-the-counter (OTC) market, which accounts for approximately 70% of global gold trading volume. Here, large banks, refineries, and institutional buyers trade 400-troy-ounce gold bars directly with each other deals worth tens of millions of dollars that settle within two business days.
The LBMA Gold Price set twice daily at 10:30 AM and 3:00 PM London time provides a widely used benchmark, but it is a snapshot, not the continuous spot price. The live spot price flows non-stop from OTC market activity between these fixes.
The COMEX Futures Exchange
The Chicago Mercantile Exchange’s COMEX division in New York is the world’s most active gold futures market. COMEX trades 100-troy-ounce gold contracts at enormous volumes often exceeding 200,000 contracts per day. While these are technically future-dated agreements, the near-month contract with the highest volume effectively sets the spot price in real time.
Here is the counterintuitive part: technically, futures prices should be derived from the spot price. In practice, because COMEX reacts to new information so rapidly and with such massive volume, the spot gold price is actually derived from the nearest active futures contract. The spot price is essentially the net present value of that front-month futures price.
The Shanghai Gold Exchange
During Asian trading hours, the Shanghai Gold Exchange (SGE) exerts significant influence on spot gold pricing. China is the world’s largest physical gold consumer, and SGE volume can move prices meaningfully particularly when Chinese retail or institutional demand surges.
How the Number You See Is Calculated
When you look at a gold price website, the platform is pulling data from one or more of these markets the London OTC market, COMEX, or their data aggregators. Minor variations between sites are normal because different platforms source data differently. The underlying price, however, represents a genuine market consensus of what institutional buyers will pay for gold right now.
Spot Gold vs. Futures vs. Physical Gold: Key Differences
These three are closely related but fundamentally different instruments. Getting them confused can cost you money.
| Feature | Spot Gold | Gold Futures | Physical Gold |
| Settlement | Within 2 business days | Specified future date | Upon purchase |
| Delivery | Usually net-settled | Mostly cash-settled | Immediate possession |
| Price basis | Current market consensus | Near-month contract | Spot + premium |
| Leverage | No (unless CFD/margin) | Yes (via margin) | No |
| Counterparty risk | Low (OTC institutional) | Exchange-cleared | Dealer dependent |
| Best for | Benchmarking, trading | Hedging, speculation | Long-term holding |
The critical distinction for investors: physical gold always costs more than the spot price, because it includes manufacturing, transport, insurance, and dealer margin. That difference is called the premium over spot.
Gold futures are usually priced above spot too a condition called contango because they incorporate the cost of carry (storage and insurance until delivery). When futures trade below spot, the market is in backwardation, which signals unusually high immediate demand.
The Global Trading Cycle: How Spot Gold Prices Move 24 Hours a Day
Spot gold trades around the clock, five days a week. Understanding the daily cycle helps you anticipate when price moves are most likely.
Asian Session (Sunday 10 PM – Monday 8 AM London time)
Trading opens in Sydney, then accelerates as Tokyo and Shanghai come online. Chinese demand patterns and SGE activity set the tone. If Chinese retail or institutional buying is strong, expect upward pressure during this window.
London Session (8 AM – 5 PM London time)
The dominant session for gold. The London OTC market’s massive institutional flows drive the bulk of daily volume. The LBMA fix at 10:30 AM provides the morning benchmark, while the 3:00 PM fix closes the European afternoon. Most significant daily moves happen here.
New York Session (1:30 PM – 5:30 PM London time, overlap period)
COMEX opens at 8:20 AM New York time, overlapping with London for several hours. This overlap creates the highest volatility window of the trading day. US economic data releases, Fed statements, and COMEX positioning shifts all impact the spot price during this period.
The Handoff
As New York closes, prices stabilise until Asian trading resumes. Weekend gaps — where geopolitical events occur while markets are closed — can create sharp opening moves on Sunday evening.
Practical tip: If you are placing a significant gold trade, the London–New York overlap (roughly 1:30–5:30 PM London time) offers the deepest liquidity, tightest spreads, and most efficient execution.
What Is the Spot Gold Price Right Now?
As of late June 2026, spot gold is trading in the $4,078–$4,224 per troy ounce range. This follows a historic rally that took gold to an all-time high above $5,500 per ounce in January 2026, and a subsequent correction and consolidation phase through mid-year.
To give this context:
| Period | Approximate Spot Gold Price |
| January 2024 | ~$2,050/oz |
| January 2025 | ~$2,650/oz |
| October 2025 | ~$4,300/oz (new ATH at the time) |
| January 28, 2026 | ~$5,500/oz (all-time high) |
| June 2026 | ~$4,078–$4,224/oz |
Gold gained roughly 42% in 2025 — the strongest annual performance since the late 1970s. The 2026 pullback from January highs represents a classic bull market consolidation. Historically, sustained gold bull runs include sharp upward spikes followed by months of sideways or corrective price action before the next leg higher.
What Drives Spot Gold Prices? The 7 Key Factors
1. US Dollar Strength (DXY)
Gold is priced globally in US dollars. When the dollar strengthens, gold becomes more expensive for overseas buyers in their own currency — reducing demand and pushing spot prices down. When the dollar weakens, gold becomes relatively cheaper globally, stimulating demand and lifting the spot price.
This inverse relationship is not always tight on a day-to-day basis, but over weeks and months, it is one of the most reliable correlations in financial markets.
2. Real Interest Rates
Gold pays no dividend or interest. Holding it has an opportunity cost — the yield you could have earned in bonds or savings accounts instead.
When real interest rates (nominal rates minus inflation) rise, the opportunity cost of holding gold increases, typically weighing on the spot price. When real rates fall — either because nominal rates drop or inflation rises — gold becomes relatively more attractive.
This is why gold often rallies when central banks cut rates, and faces headwinds when they hike aggressively.
3. Inflation and Currency Debasement
Gold has been used as a store of value for thousands of years precisely because its supply cannot be printed. When inflation erodes the purchasing power of paper currencies, investors historically move toward gold as a monetary anchor.
US producer prices climbed 6.5% year-over-year in May 2026, reinforcing gold’s appeal as a purchasing power hedge in the current environment.
4. Central Bank Buying and Selling
This is one of the most powerful — and least understood — drivers of the spot gold price. More on this in the dedicated section below, but the short version is: central banks now account for roughly 25% of annual global gold demand, and their buying patterns directly support the spot price floor.
5. Geopolitical Risk
Gold is the ultimate safe-haven asset. When geopolitical tensions rise — conflicts, sanctions, trade wars, political instability — institutional and retail investors alike buy gold as insurance. This flight-to-safety demand can move the spot price sharply in a matter of hours.
6. Gold ETF Flows
Exchange-traded funds backed by physical gold are a major channel for institutional and retail investment demand. When ETFs see large net inflows, they purchase physical gold in wholesale markets, directly increasing spot demand. Outflows have the opposite effect.
In 2025, US-listed gold ETFs added 437 tonnes, pushing holdings to a record 2,019 tonnes with over $280 billion in assets under management.
7. Mine Supply
Gold supply grows slowly. Mine production has increased by only approximately 0.3% per year on average since 2018 due to permitting delays, environmental regulations, and declining ore grades at existing mines. Limited supply growth in the face of rising demand creates a structural upward bias over long timeframes.
How Central Bank Gold Buying Impacts Spot Gold Prices
Central bank buying deserves its own section — because it is qualitatively different from every other type of gold demand, and it is the factor most responsible for gold’s structural bull market in 2024–2026.
The Scale of Sovereign Demand
Central banks globally have been net buyers of gold every year since 2010. But the pace accelerated dramatically after 2022, when Western nations froze approximately $300 billion in Russian central bank assets. That event demonstrated to reserve managers worldwide that foreign-held paper assets can be immobilised overnight. Gold, held in domestic vaults, cannot.
The numbers since then have been staggering. In Q1 2026 alone, central banks purchased 244 tonnes of gold on a net basis — up 17% quarter-over-quarter — spending a record $37 billion in a single quarter.
Why Their Buying Is Different
Most investors buy gold when it looks cheap and sell when it looks expensive. Central banks do not operate that way. They buy to hit reserve allocation targets — and those targets are set by policy, not by price.
The practical result: central bank demand is price-insensitive in a way that no other buyer is. When spot gold falls 10%, sovereign buyers do not panic-sell. Many actually accelerate purchases, because dips represent an opportunity to acquire more gold at a lower cost toward their targets.
This creates what professional traders call a structural price floor — a zone where sovereign buying becomes so concentrated that it prevents sustained corrections below certain levels. In 2026, that floor is estimated around the $4,500–$4,600 range, and the Q1 2026 data shows central banks became significantly more active as prices pulled back from January highs.
Who Is Buying in 2026?
- Poland — the largest disclosed buyer, actively targeting 700 total tonnes as a NATO security-driven reserve strategy
- China — believed to be the largest overall buyer, with much accumulation occurring off the books; net gold imports in Q1 2026 ran at 317 tonnes, nearly three times the prior quarter
- India, Kazakhstan, Uzbekistan — all active buyers reflecting broader emerging market de-dollarisation trends
- Brazil — re-entered the market in late 2025 after a four-year absence
The De-Dollarisation Backdrop
Behind all of this buying is a structural macro trend: de-dollarisation. BRICS+ nations now hold 17.4% of global gold reserves, up from 11.2% in 2019. US federal debt has surpassed $36 trillion. Reserve managers are quietly but persistently rebalancing — and gold is the primary beneficiary.
The World Gold Council’s 2025 Central Bank Survey found that 95% of central banks expected global gold holdings to increase over the following 12 months. Not one expected a decline. That consensus is a powerful signal for anyone trading the spot gold market.
Spot Gold, Premiums, and What You Actually Pay
One of the most common sources of confusion for new investors: the price you pay for physical gold is always higher than the spot gold price.
That difference is called the premium over spot, and it covers the real-world costs involved in turning raw gold into a product you can hold:
- Refining and minting — processing raw gold into bars or coins
- Packaging and certification — authentication, assay, packaging
- Insurance and shipping — secure transport from refinery to dealer to buyer
- Dealer margin — the dealer’s profit and operating costs
Typical Premiums by Product Type
| Gold Product | Typical Premium Over Spot |
| Large gold bars (10 oz+) | 0.5% – 2% |
| Small gold bars (1 oz) | 2% – 5% |
| Government bullion coins (e.g., Sovereigns, Eagles) | 4% – 8% |
| Numismatic or rare coins | 10% – 50%+ |
| Gold jewellery | 50% – 300%+ |
The takeaway is straightforward: if you are buying gold as an investment, bars and standard government bullion coins offer the lowest premiums and are therefore the most efficient way to gain close-to-spot-price exposure to physical gold.
When you sell, dealers will pay you below spot — the bid price — which creates a bid-ask spread. The smaller that spread, the more liquid the market and the lower your transaction cost.
How to Trade and Invest Using Spot Gold
There are several practical ways to gain exposure to spot gold, each suited to different goals, capital sizes, and risk tolerances.
1. Gold CFDs (Contracts for Difference)
CFDs allow you to trade the spot gold price directly — going long (buying) if you expect the price to rise, or short (selling) if you expect it to fall — without taking physical delivery.
Pros: High liquidity, tight spreads, leverage available, trade long and short. Cons: Leverage amplifies losses, overnight funding charges apply, no physical ownership.
Best for: Active traders who want to speculate on short-to-medium-term price movements.
2. Physical Gold (Bars and Coins)
Buying physical gold means purchasing real metal at spot price plus a premium, and arranging secure storage.
Pros: No counterparty risk, tangible asset, no management fees. Cons: Premium over spot, storage and insurance costs, less liquid than paper gold.
Best for: Long-term wealth preservation investors who value outright ownership.
3. Gold ETFs
Physically-backed gold ETFs hold real gold in vaults and issue shares that track the spot price. iShares Gold Trust (IAU) and SPDR Gold Shares (GLD) are the largest examples.
Pros: Highly liquid, low bid-ask spreads, no storage concerns, near-spot pricing. Cons: Annual management fees (typically 0.25%–0.40%), no physical possession, ETF counterparty exposure.
Best for: Investors who want near-spot gold exposure with the convenience of a stock brokerage account.
4. Gold Futures
COMEX gold futures allow you to agree today to buy or sell gold at a future date at today’s spot-derived price.
Pros: Deep liquidity, price discovery mechanism, effective for hedging. Cons: Leverage, rollover costs, complexity for beginners.
Best for: Institutional traders, hedgers, and sophisticated speculators.
Spot Gold vs. Gold ETFs vs. Gold Mining Stocks
| Characteristic | Spot Gold / Physical | Gold ETFs | Gold Mining Stocks |
| Correlation to spot price | 1:1 (physical) | Very high | Partial (leveraged to margin) |
| Leverage to gold price | None | None | Yes (operational leverage) |
| Counterparty risk | None (physical) | ETF issuer | Company management |
| Dividend/income | None | None | Possible |
| Liquidity | Moderate | Very high | High |
| Upside in bull markets | Moderate | Moderate | Potentially higher |
| Downside in bear markets | Moderate | Moderate | Often worse than spot |
Key insight for investors: Mining stocks historically lag physical gold in the early stages of a gold bull market, then outperform sharply once the profitability of mining operations becomes obvious to the market. In 2026, with spot gold elevated but pulling back from highs, watching for that catch-up move in quality gold producers is a secondary trade professionals are monitoring.
Advantages and Disadvantages of Spot Gold
Advantages
- Universal benchmark — the spot price is the single agreed reference for all gold transactions globally, creating transparency
- 24/5 liquidity — spot gold trades continuously Monday through Friday, offering flexibility to react to events at any hour
- Inflation hedge — gold’s historical record as a store of value through inflationary periods is unmatched among commodities
- Portfolio diversification — gold’s low long-term correlation to equities and bonds makes it a genuine diversifier
- Safe-haven demand — in crises, gold typically holds or gains value while risk assets fall
- No credit risk — physical gold has no issuer and cannot default
Disadvantages
- No yield — spot gold pays no interest, dividend, or coupon. In high-rate environments, the opportunity cost of holding it rises
- Storage costs — physical gold requires secure storage and insurance
- Price volatility — spot gold can fall 10–20% in corrections, as seen in 2026 when it pulled back from January’s all-time high
- Premium friction — buying and selling physical gold involves dealer premiums and bid-ask spreads that create transaction costs
- US dollar dependency — since gold is priced in USD, non-US investors face currency risk on top of gold price risk
Actionable Takeaways for Every Experience Level
Beginners
- Start with one data source you trust for the live spot price — goldprice.org, the World Gold Council, or your broker’s platform.
- Understand that the price you pay for any gold product will be higher than the spot price you see quoted. That premium is legitimate and normal.
- Begin with gold ETFs if you want near-spot exposure with no storage hassle and minimal transaction friction.
- Set a Google alert for “LBMA Gold Price” and check it weekly to build your understanding of how the benchmark moves.
Intermediate Traders
- Start tracking the five core spot gold drivers weekly: DXY (dollar index), US 10-year real yield, gold ETF flows (WGC data), COMEX net speculative positioning (COT report), and central bank purchase disclosures.
- Learn to read the COMEX Commitment of Traders (COT) report, published every Friday. It shows whether institutional futures traders are adding or reducing long positions — a strong directional signal.
- Understand contango vs. backwardation in the gold futures curve. Persistent backwardation (futures below spot) signals unusually intense immediate demand.
- Use the London–New York trading overlap window for highest liquidity when executing spot-linked trades.
Advanced Traders
- Integrate central bank reserve data from the IMF’s monthly IFS database into your systematic analysis. New entries or acceleration by large buyers can precede significant spot price moves.
- Monitor London OTC clearing volume and Swiss refinery bilateral trade data for signals of unreported sovereign buying activity often the earliest available indicator of Chinese accumulation.
- Track the gold-silver ratio (currently elevated vs. historical norms) for rotational trading signals: when the ratio peaks and turns lower, silver tends to outperform gold, suggesting risk appetite is returning to the precious metals complex.
- Analyse real yield curves across G10 economies for the relative attractiveness of holding gold versus bonds particularly the US 10-year TIPS yield.
Conclusion
Spot gold is not just a number on a financial website. It is the heartbeat of a $14 trillion global market a real-time signal of confidence in currencies, economies, and geopolitical stability worldwide.
Understanding what spot gold is, how it is priced, what drives it, and how central bank buying shapes its structural floor gives you a genuine analytical advantage regardless of whether you are placing your first gold trade or managing a multi-asset portfolio.
The 2026 gold market is particularly instructive. Gold’s all-time high above $5,500 in January, followed by a correction to the $4,078–$4,224 range, has played out exactly as structural demand mechanics would predict: central banks accelerated buying into the dip, providing precisely the demand support that professional traders anticipated.
The fundamentals that drove this bull market de-dollarisation, fiscal concerns, sovereign accumulation, ETF demand, and dollar weakness remain firmly intact. Spot gold is not just an asset to trade. In 2026, it is a barometer for the entire global financial system.
Whether you are buying your first gold bar, opening a CFD position, or building a systematic macro trading strategy, start here: understand spot gold. Everything else follows from it.
Call to Action
Ready to start tracking spot gold like a professional? Bookmark the World Gold Council’s live gold price page and the IMF International Financial Statistics portal. Set a monthly calendar reminder to check central bank reserve data when the IMF publishes its update. The tools are free. The edge is in knowing how to use them.
Frequently Asked Questions
1. What is spot gold in simple terms?
Spot gold is the current live price for one troy ounce of pure gold for immediate purchase or sale in the global wholesale market. It is the universal reference price from which all other gold products bars, coins, ETFs, futures derive their value.
2. Can the spot gold price go negative?
No. Unlike crude oil futures, which briefly went negative in April 2020 due to extreme storage constraints, gold has no equivalent storage problem. Gold is durable, compact, and universally valued. The spot price cannot go negative.
3. Why is the physical gold price higher than the spot gold price?
Physical gold always trades above spot because it carries real-world costs: refining, minting, packaging, authentication, insurance, shipping, and the dealer's operating margin. These costs together are called the "premium over spot." Simple gold bars carry premiums as low as 0.5–2%, while rare coins can command 50% or more above spot.
4. How do central banks affect the spot gold price?
Central banks are among the largest gold buyers in the world, accounting for approximately 25% of annual global gold demand. Because they buy to hit reserve allocation targets rather than to speculate, their demand is price-insensitive — they buy regardless of whether prices are rising or falling. This creates a structural floor under the spot price. In Q1 2026, central banks spent a record $37 billion on gold in a single quarter, demonstrating continued sovereign commitment even as prices pulled back from January highs.
5. Is spot gold a good investment in 2026?
Major financial institutions including J.P. Morgan, Morgan Stanley, and State Street Global Advisors maintain bullish gold outlooks for 2026, citing continued central bank demand, ETF inflows, dollar weakness, and elevated geopolitical risk. Spot gold can be a strong component of a diversified portfolio, particularly as an inflation hedge and safe-haven asset. However, it is volatile, pays no income, and its short-term price is unpredictable. Always consider your own risk tolerance and investment horizon.